Managing processes is a fundamental aspect of system administration in Linux. Understanding the hierarchy of processes and their relationships can be crucial for effective system monitoring and troubleshooting. This blog post will guide you through various methods to display process trees in Linux, providing clear and visual representations of running processes and their parent-child relationships.
We’ll cover commands like ps, pstree, top, and htop, demonstrating how to use them to visualize process hierarchies with practical examples.
Using ps Command to Show Process Tree
The ps command in Linux is a powerful utility for displaying information about running processes. It can be used to show a snapshot of the current processes, including details such as the process ID (PID), the parent process ID (PPID), CPU usage, memory usage, and more. To visualize the process hierarchy, the ps command offers several options that enable users to display processes in a tree format.
Basic Usage of ps
The ps command, by default, displays processes running in the current shell session. For example, running ps without any options provides a simple list of processes:
psOutput:
  PID TTY          TIME CMD
  1234 pts/0    00:00:00 bash
  5678 pts/0    00:00:00 ps
Displaying Process Hierarchy Using ps –forest
To display the process hierarchy, we use the ps command with specific options that enable hierarchical formatting. The most common option for this purpose is the --forest option, which displays the processes in a tree-like format.
The --forest option adds a tree structure to the output, illustrating the parent-child relationships between processes.
ps --forestOutput:
  PID TTY          TIME CMD
  1234 ?        00:00:00 init
   ├─ 2345 ?    00:00:00 bash
   │   ├─ 3456 ? 00:00:00 ps
   │   └─ 4567 ? 00:00:00 sleep
   └─ 5678 ?    00:00:00 sshd
In this output, the tree structure shows init as the root process, with bash, ps, sleep, and sshd as its child processes.
Combining ps Options for Detailed Output
For more detailed information, we can combine the --forest option with other ps options. For example, using ps -e --forest displays all processes in a tree format, while ps -ef --forest provides a full-format listing including user information.
Using ps -e –forest
ps -e --forestOutput:
  PID TTY          TIME CMD
    1 ?        00:00:00 init
   2345 ?    00:00:00 bash
   ├─ 3456 ? 00:00:00 ps
   └─ 4567 ? 00:00:00 sleep
  5678 ?    00:00:00 sshd
Using ps -ef –forest
ps -ef --forestOutput:
UID        PID  PPID  C STIME TTY          TIME CMD
root         1     0  0 00:00 ?        00:00:00 init
root      2345     1  0 00:01 ?        00:00:00 bash
root      3456  2345  0 00:02 ?        00:00:00  \\\\_ ps
root      4567  2345  0 00:03 ?        00:00:00  \\\\_ sleep
root      5678     1  0 00:04 ?        00:00:00 sshd
In this output, the additional columns provide user ID (UID), parent process ID (PPID), CPU usage (C), start time (STIME), and more, giving a comprehensive view of the process tree.
Using pstree Command to Show Process Tree
The pstree command in Linux is a specialized utility designed to display running processes in a tree format. It provides a clear, visual representation of the process hierarchy, making it easier to understand the relationships between parent and child processes. Unlike the ps command, pstree focuses solely on the tree structure, offering several options to customize the display for different needs.
Basic Usage of pstree
The basic usage of pstree without any options displays the entire process tree starting from the init process (PID 1 or systemd).
pstreeSample Output:
systemd─┬─NetworkManager───2*[{NetworkManager}]
        ├─accounts-daemon───2*[{accounts-daemon}]
        ├─agetty
        ├─apache2───2*[apache2───5*[kworker/u2:1]]
        ├─at-spi-bus-laun─┬─dbus-daemon
        │                 └─3*[{at-spi-bus-laun}]
        ├─avahi-daemon───avahi-daemon
        ├─cron
        ├─dbus-daemon
        ├─dockerd───docker-containe───10*[{docker-containe}]
        ├─init───init───bash
        ├─login───bash
        ├─systemd-journal
        └─systemd-logind
In this output, pstree shows the systemd process at the root, with various child processes branching out, clearly illustrating their hierarchical relationships.
Displaying Process IDs
To display the process IDs (PIDs) alongside the process names, use the -p option. This is particularly useful for identifying specific processes and their IDs within the tree.
pstree -pOutput:
systemd(1)─┬─NetworkManager(861)───2*[{NetworkManager}(871)]
           ├─accounts-daemon(862)───2*[{accounts-daemon}(872)]
           ├─agetty(863)
           ├─apache2(864)───2*[apache2(865)───5*[kworker/u2:1(866)]]
           ├─at-spi-bus-laun(867)─┬─dbus-daemon(868)
           │                      └─3*[{at-spi-bus-laun}(869)]
           ├─avahi-daemon(870)───avahi-daemon(871)
           ├─cron(872)
           ├─dbus-daemon(873)
           ├─dockerd(874)───docker-containe(875)───10*[{docker-containe}(876)]
           ├─init(877)───init(878)───bash(879)
           ├─login(880)───bash(881)
           ├─systemd-journal(882)
           └─systemd-logind(883)
Highlighting a Specific User’s Processes
To display the process tree for a specific user, use the -u option followed by the username. This can help in monitoring and managing processes for a particular user.
pstree -u usernameOutput:
systemd─┬─NetworkManager(username)───2*[{NetworkManager}(username)]
        ├─accounts-daemon(username)───2*[{accounts-daemon}(username)]
        ├─agetty(username)
        ├─apache2(username)───2*[apache2(username)───5*[kworker/u2:1(username)]]
        ├─at-spi-bus-laun(username)─┬─dbus-daemon(username)
        │                           └─3*[{at-spi-bus-laun}(username)]
        ├─avahi-daemon(username)───avahi-daemon(username)
        ├─cron(username)
        ├─dbus-daemon(username)
        ├─dockerd(username)───docker-containe(username)───10*[{docker-containe}(username)]
        ├─init(username)───init(username)───bash(username)
        ├─login(username)───bash(username)
        ├─systemd-journal(username)
        └─systemd-logind(username)
Displaying ASCII Art Tree
To enhance readability, especially for complex trees, the -G option uses ASCII art lines to visually connect parent and child processes.
pstree -GOutput:
systemd
 |-- NetworkManager
 |   `-- 2*[{NetworkManager}]
 |-- accounts-daemon
 |   `-- 2*[{accounts-daemon}]
 |-- agetty
 |-- apache2
 |   |-- apache2
 |   `-- 5*[kworker/u2:1]
 |-- at-spi-bus-laun
 |   |-- dbus-daemon
 |   `-- 3*[{at-spi-bus-laun}]
 |-- avahi-daemon
 |   `-- avahi-daemon
 |-- cron
 |-- dbus-daemon
 |-- dockerd
 |   `-- docker-containe
 |       `-- 10*[{docker-containe}]
 |-- init
 |   `-- init
 |       `-- bash
 |-- login
 |   `-- bash
 |-- systemd-journal
 `-- systemd-logind
Using top Command to Show Process Tree
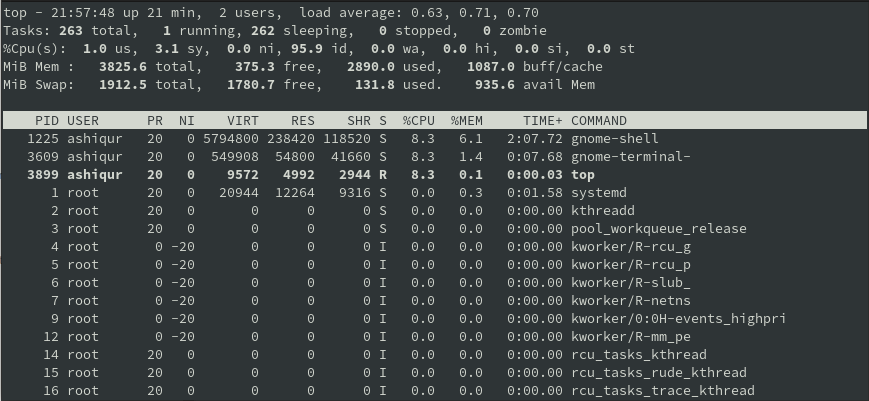
The top command is a powerful, real-time utility in Linux that provides a dynamic view of system processes. It displays a live, continuously updated list of processes, sorted by various criteria like CPU and memory usage.
By default, top displays a list of processes, including details such as process ID (PID), user, priority, nice value, virtual memory size, resident set size, shared memory size, CPU usage, memory usage, and the command name. To start top, simply type:
topOutput:
Enabling Tree View in top
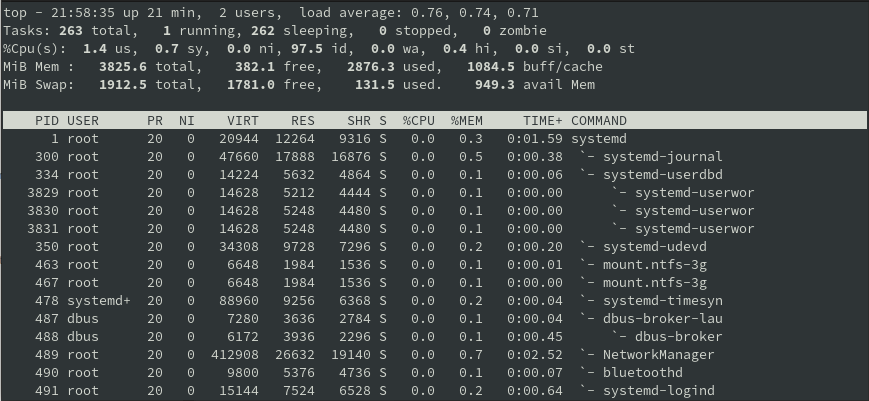
To display processes in a tree view within top, you need to enable the tree view mode. This can be done interactively while top is running or by using command-line options.
Start top
top- Press
V(uppercase ‘V’) to toggle the tree view mode or use the following code
top -d 1Sample Output with Tree View:
Customizing top for Tree View
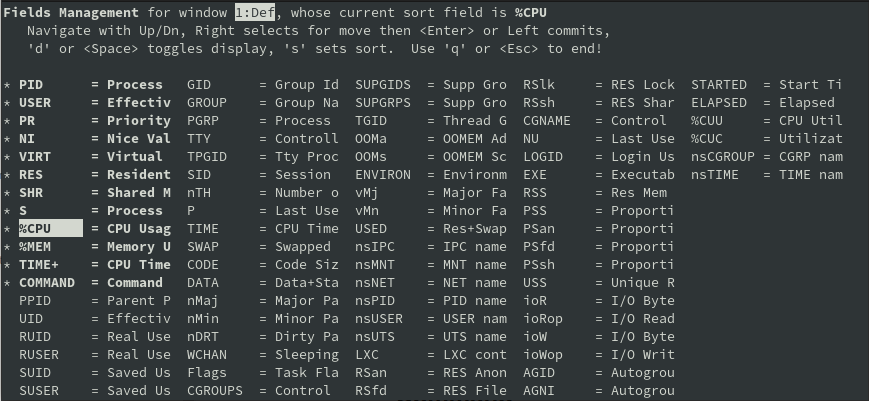
In addition to enabling tree view, top allows you to customize the displayed columns to better suit your needs. Press f to enter the field management screen, where you can add or remove fields and reorder them. This customization can help highlight specific process attributes relevant to your monitoring tasks.
Start top by typing top.
top- Press
fto enter the field management screen. - Use the arrow keys to navigate and the spacebar to toggle fields.
- Press
Enterto return to the main screen with your customized view.
Output:
Using htop Command to Show Process Tree
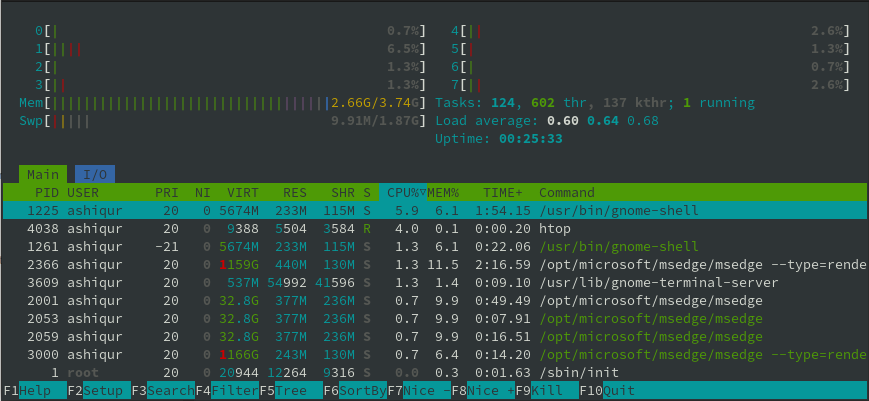
The htop command is a powerful interactive process viewer for Unix systems. It is an enhanced version of the top command, offering a more user-friendly interface and additional features that make it easier to manage and monitor system processes. One of the standout features of htop is its ability to display processes in a tree view, providing a clear visualization of the process hierarchy.
Installing htop
htop is not always pre-installed on all Linux distributions, but it can be easily installed using the distribution’s package manager. For instance, on Debian-based systems, you can install htop with the following command:
sudo apt-get install htopOn Red Hat-based systems, use:
sudo dnf install htopBasic Usage of htop
Once installed, you can start htop by typing
htopWhen you launch htop, it opens a colorful, interactive interface displaying a real-time view of the system’s processes. It provides an overview of CPU and memory usage, swap usage, and detailed information about each running process.
Output
Enabling Tree View in htop
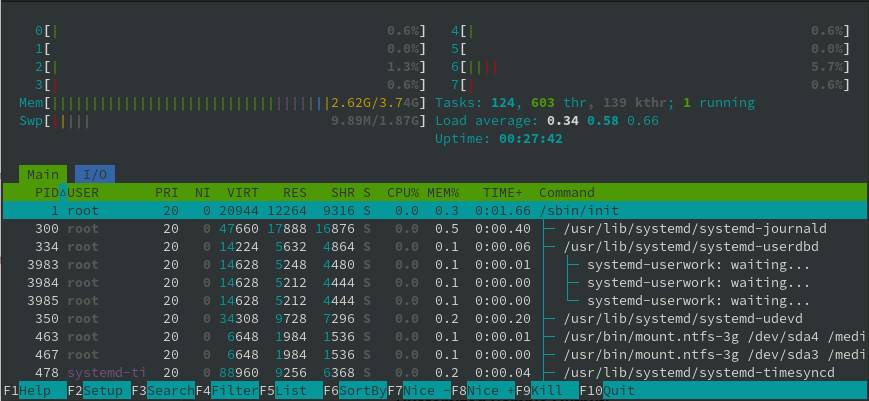
To visualize the process hierarchy, htop offers a tree view mode. This can be enabled interactively while htop is running. Start htop
htop- Press
F5to toggle the tree view mode.
Output with Tree View:
Customizing htop for Detailed Information
htop allows extensive customization to display additional columns and change sorting criteria. This customization can enhance the utility of the tree view, providing more context about each process. Start htop by typing htop.
htop- Press
F2to enter the setup menu. - Navigate to the “Columns” section using the arrow keys.
- Use the arrow keys and spacebar to add or remove columns.
- Press
F10to save the changes and return to the main screen.
Filtering Processes by User
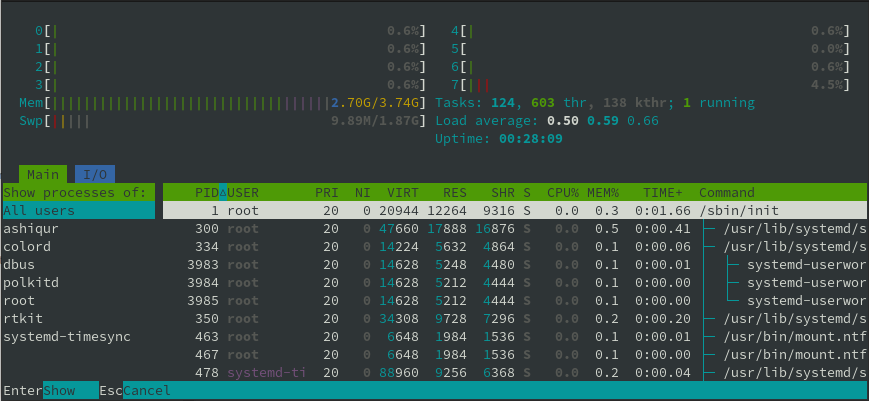
htop also allows you to filter processes by user, which is useful when you need to monitor processes for a specific user.
Start htop by typing htop.
htop- To filter by user, press
uand then type the username.
Conclusion
Understanding and visualizing the process hierarchy in Linux is essential for effective system management. Tools like ps, pstree, top, and htop provide powerful ways to display process trees, offering insights into the relationships and statuses of running processes. By mastering these commands, you can better monitor, manage, and troubleshoot your Linux system, ensuring optimal performance and stability.


